
1. How to access the Stagecast room analytics
2. How to use and interpret the Stagecast room analytics
3. How to use the time picker of the room analytics
The Stagecast room analytics give you an overview of the success of your activities.
If you want even more details about the success of a specific activity, you can access the "activity analytics" (You access the activity analytics via the three dots next to the name on the activity card).
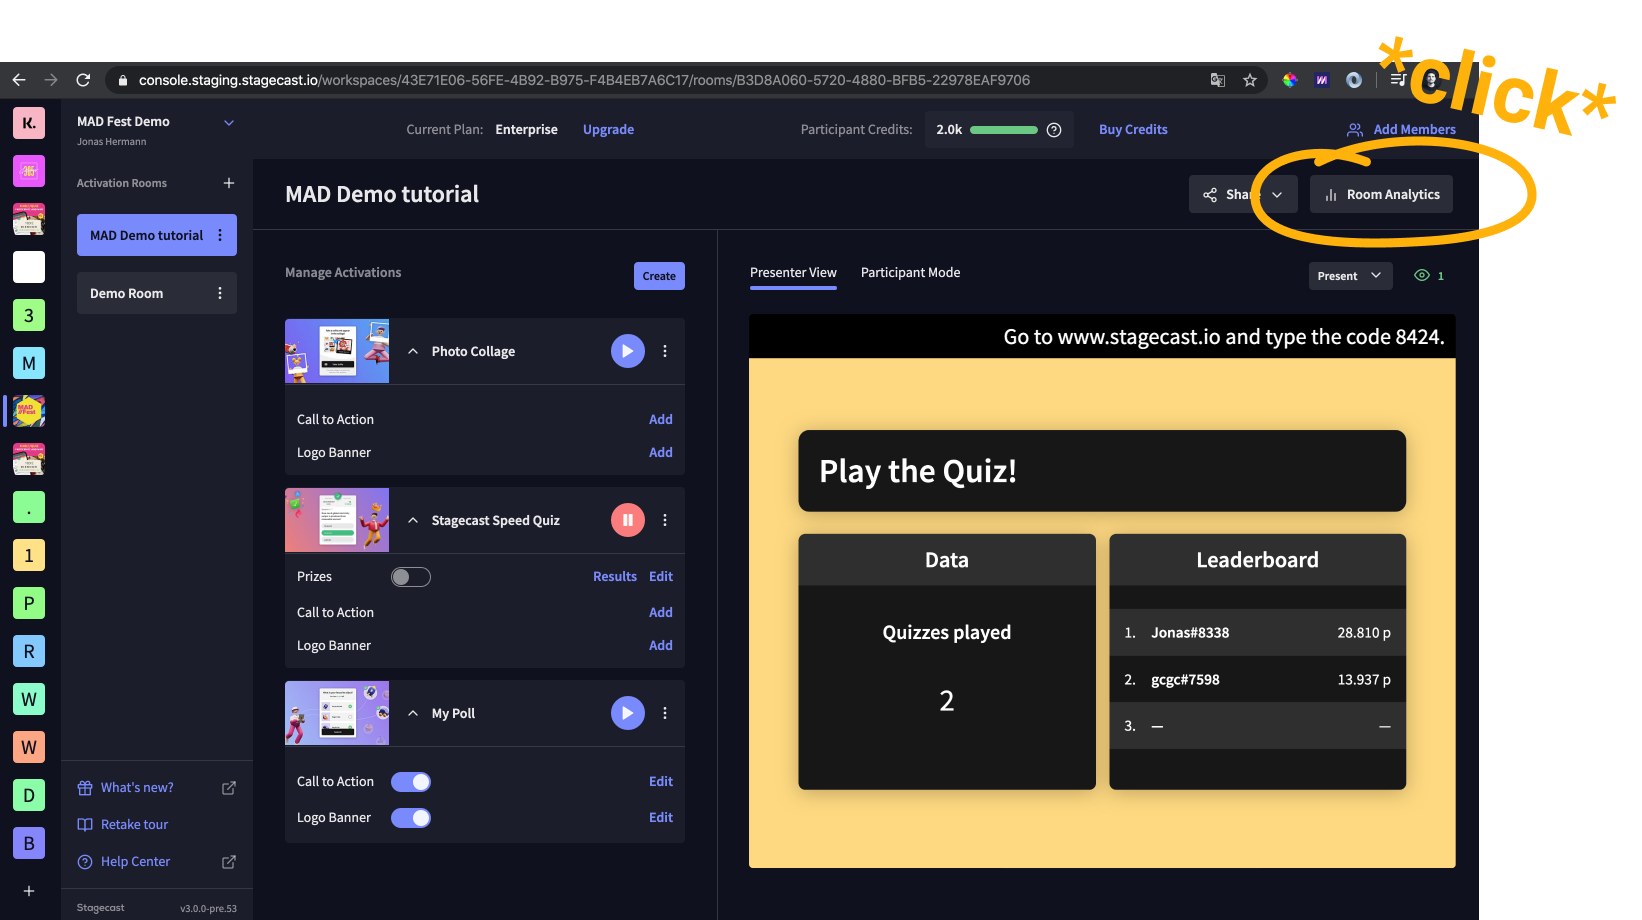
In order to access the Stagecast room analytics, you must at least have a Stagecast Pro plan. If you have a Stagecast Pro or Enterprise plan, you can access the room analytics on the top right of the console.
In the room analytics, you receive insights about the number of participants who have joined your room as well as how many activity sessions were started during a certain period of time. In the image below, you find an overview of what data you receive in the room analytics.
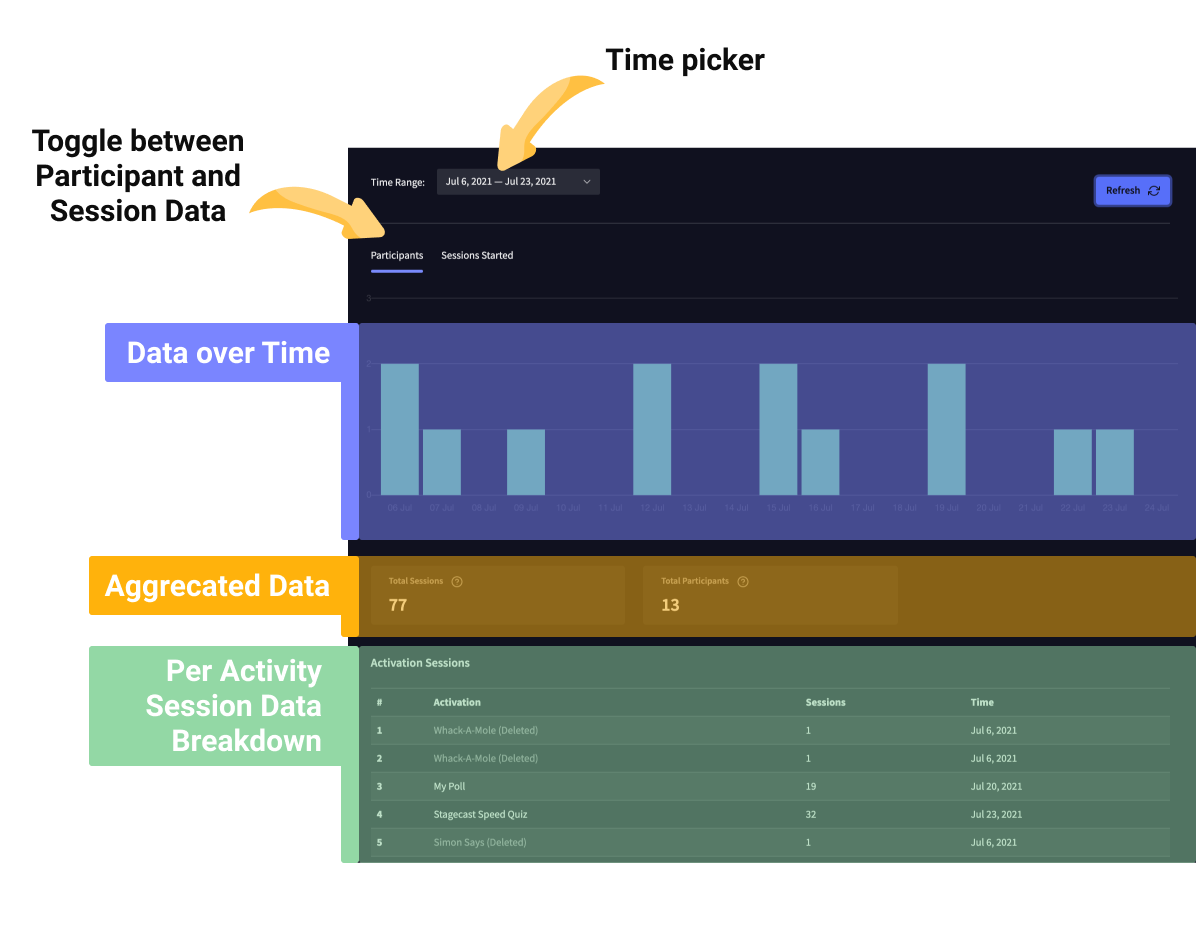
When a participant joined your room, he or she is counted under "participants". Each time a participant joins a new activity in your room, it is counted as "session started". Hence, if a participant joins your room once and participates in 3 different activities, he or she has been counted once in the "participants" statistic and three times in the "total sessions" statistic.
The "per activity session data breakdown" helps you understand which activity was particularly successful in your room. Deleted activities are marked as "(Deleted)".
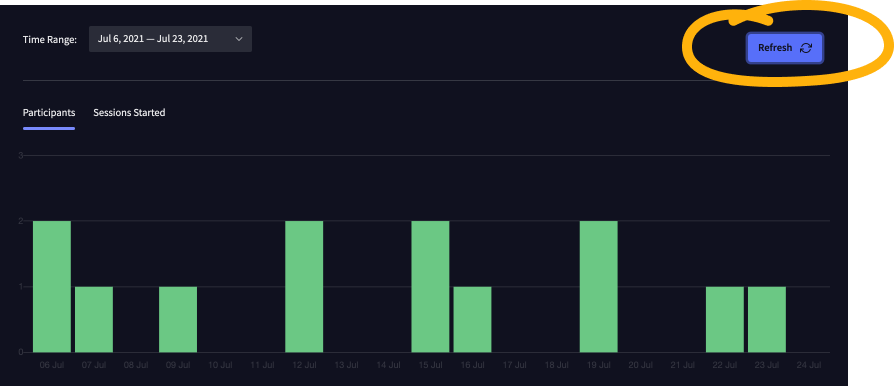
Important to note: The room analytics do no update automatically. To make sure you are working with the most up-to-data data, you have to refresh the room manually on the top right of the room analytics window.
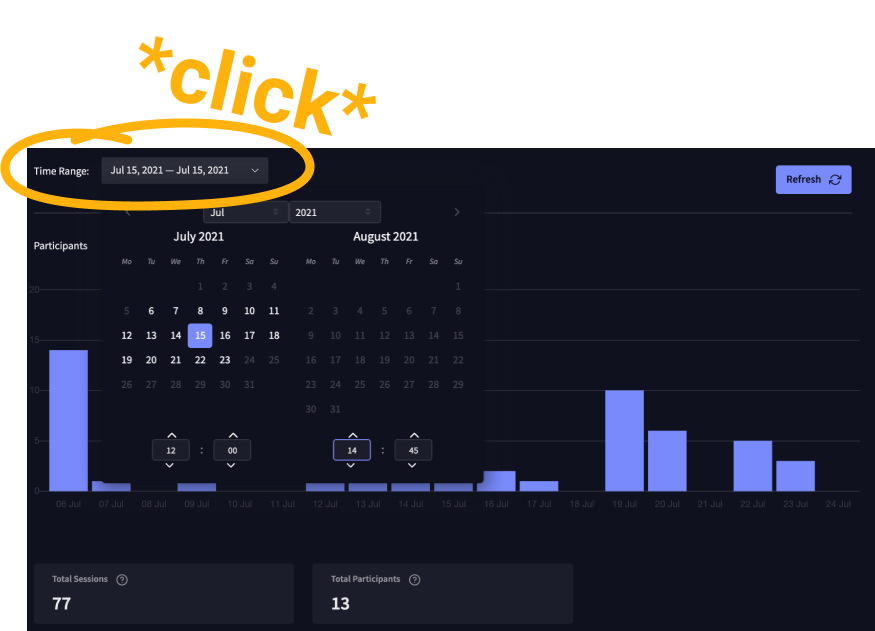
The time picker on the top left of the room analytics allow you to filter the statistics in the data over time graph below. You can filter days as well as hours, which helps you to understand at what exact time participants joined your room or activities.
Important to note: With the time range, you only filer the information in the graph on top. The aggregated data as well as the breakdown per activity below the graph on top are not affected by the time you set in the time picker and are always accumulative to the latest point in time when you updated the data report.
Easy as that! Now you know how to use the room analytics ! 🚀
During business hours (CET), you can typically reach us immediately via the chat window on the bottom right of your screen. Alternatively, you can also send us an e-mail to support@stagecast.io
Take a look at our Terms of service and review our Privacy Policy. We handle your data with care and are committed to GDPR compliance and data & application security.


